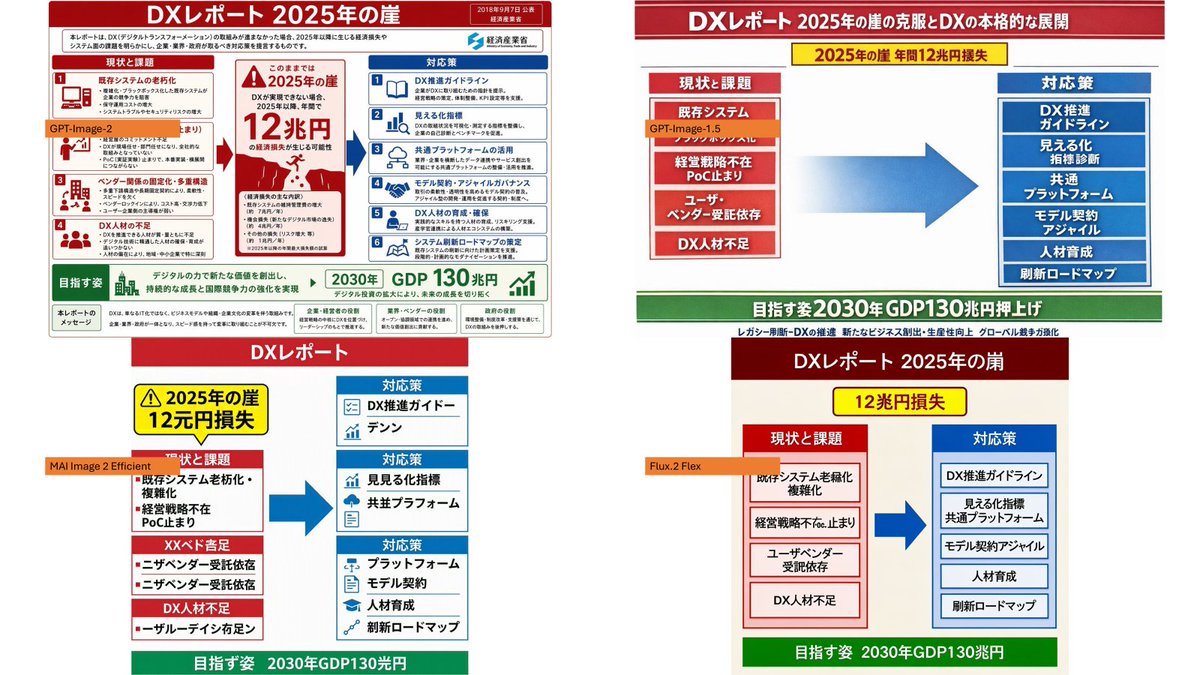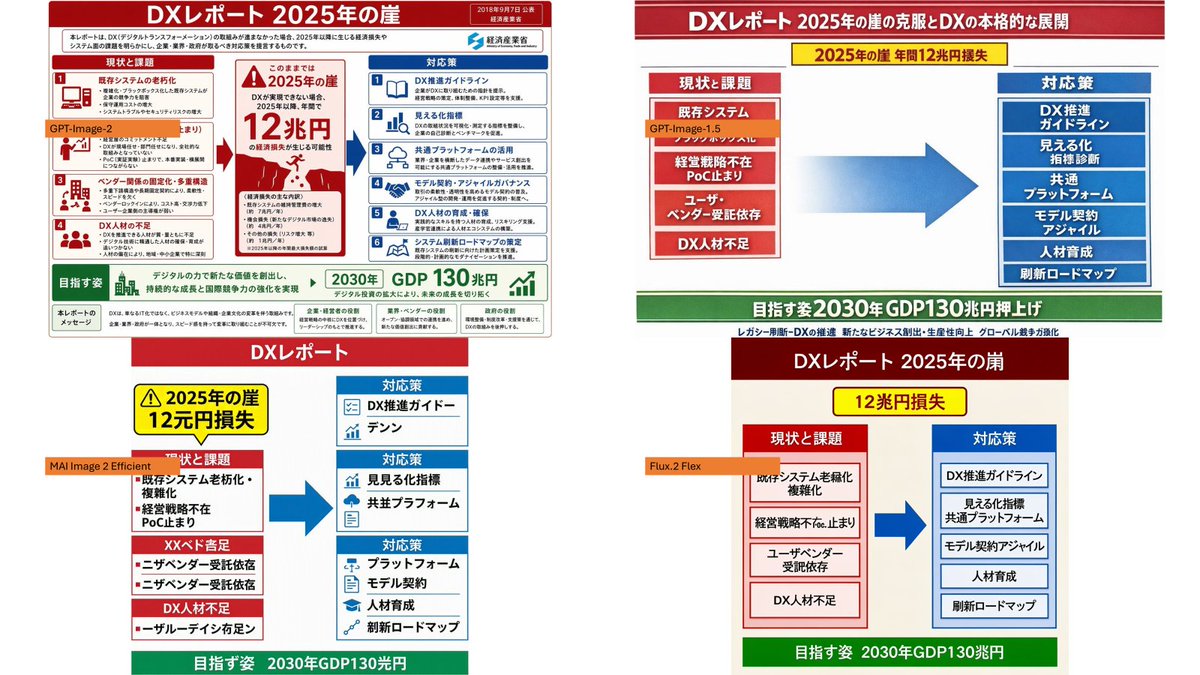
DX 信息图模型对比
创建一个四格对比拼图,展示不同模型风格对日本 DX Report 信息图参考图像的重现效果。
- Category
- Charts & Infographics
- Model
- GPT Image 2
- Creator
- そうい|AI活用術 × 明日から使えるPowerBI分析
- Source language
- en
- Source ID
- 20618
- Published
- May 15, 2026
Full prompt
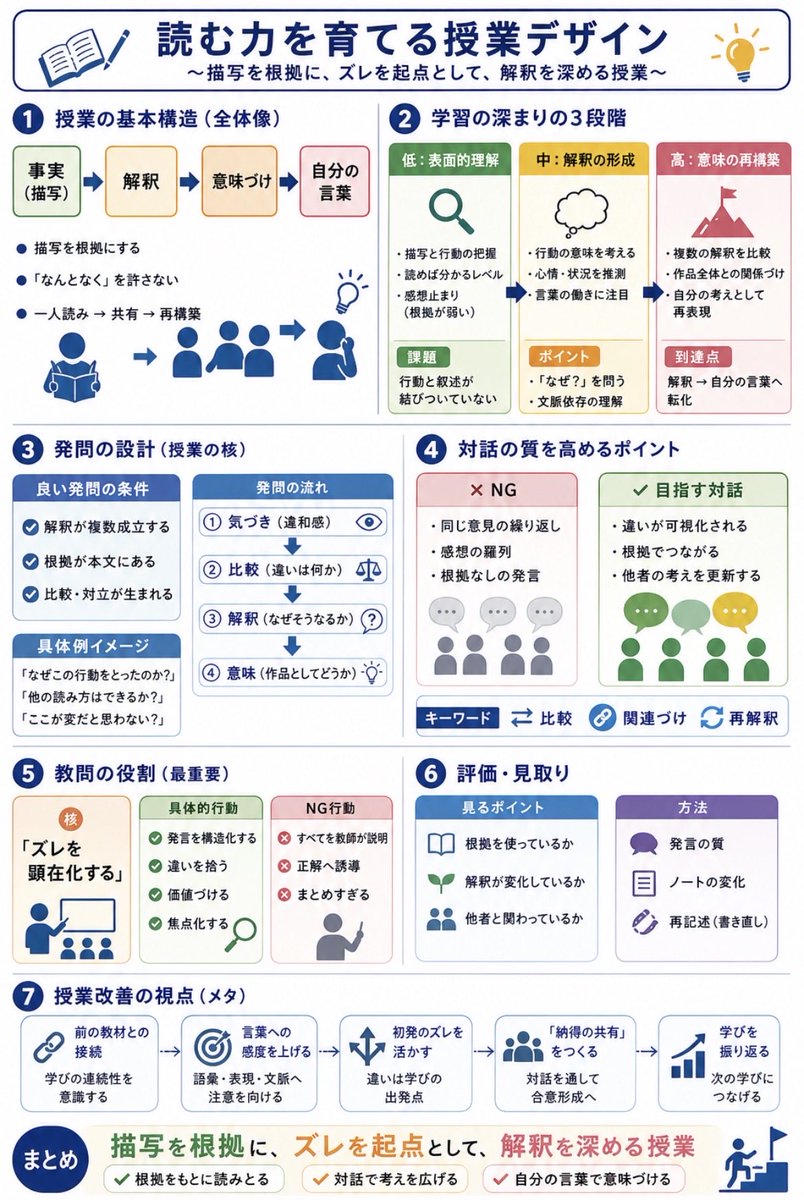
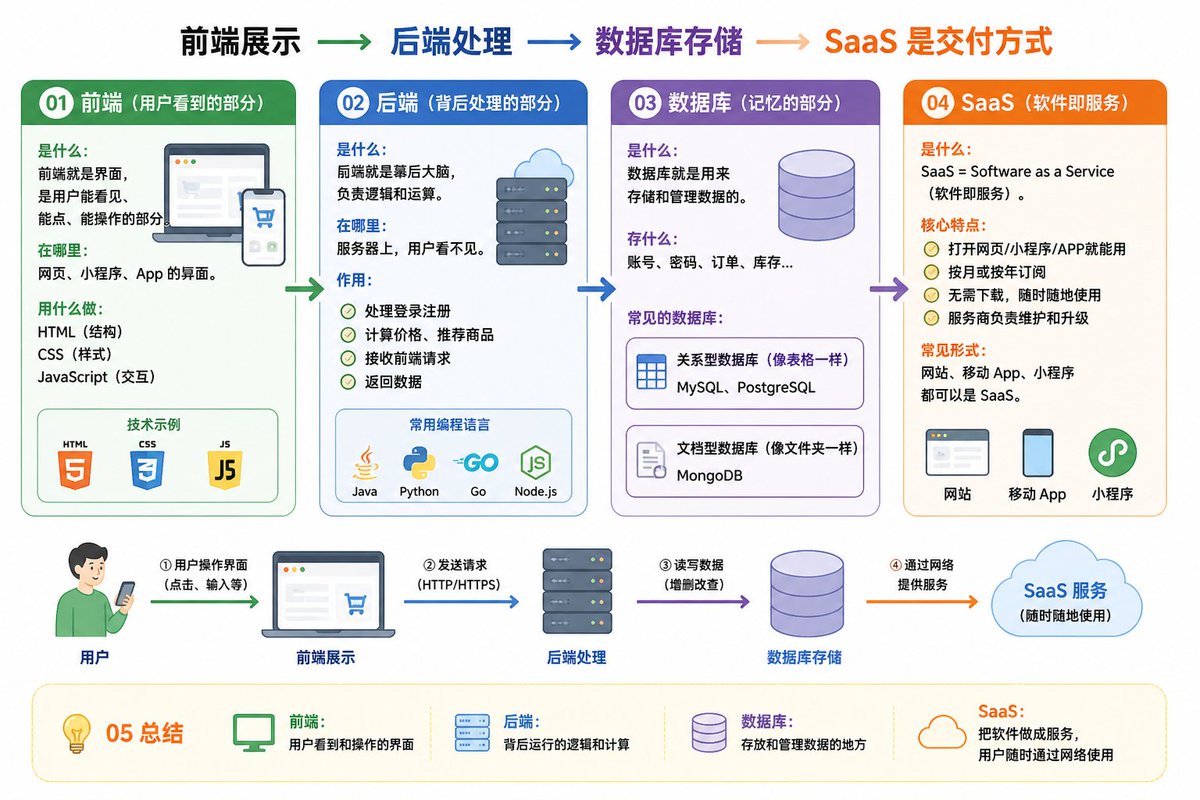
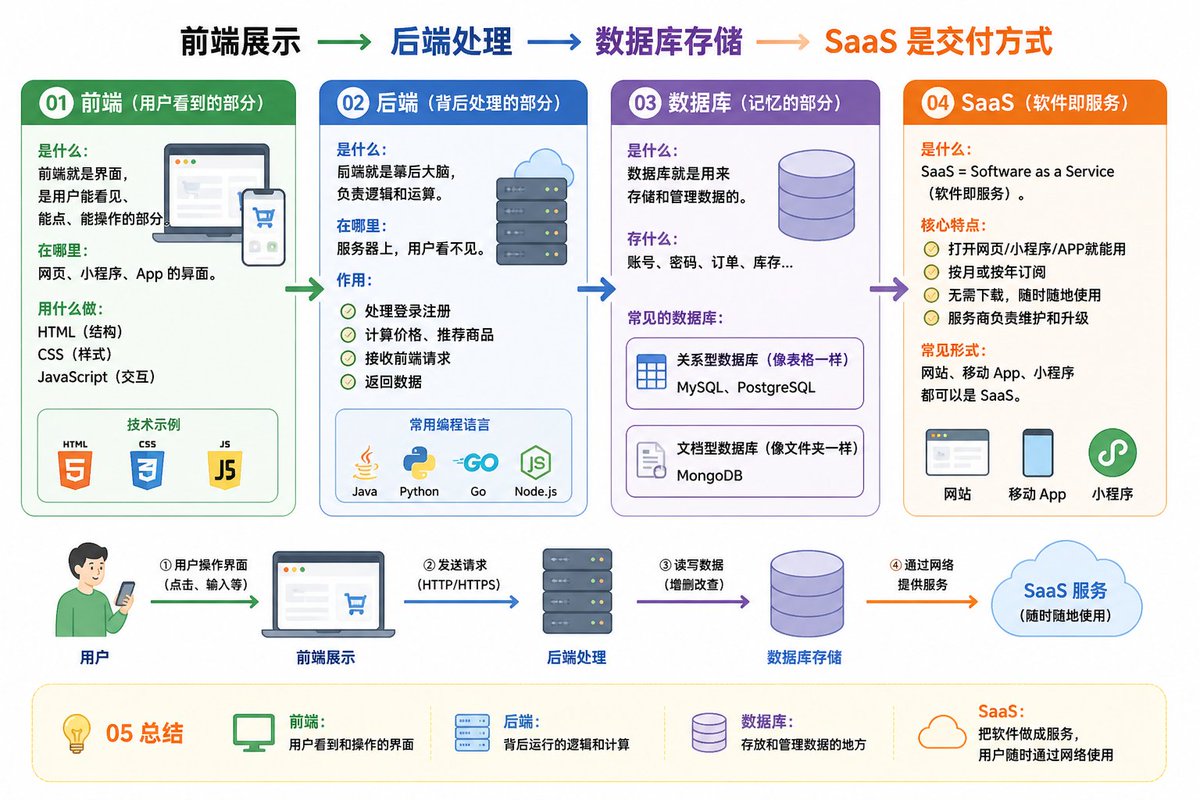
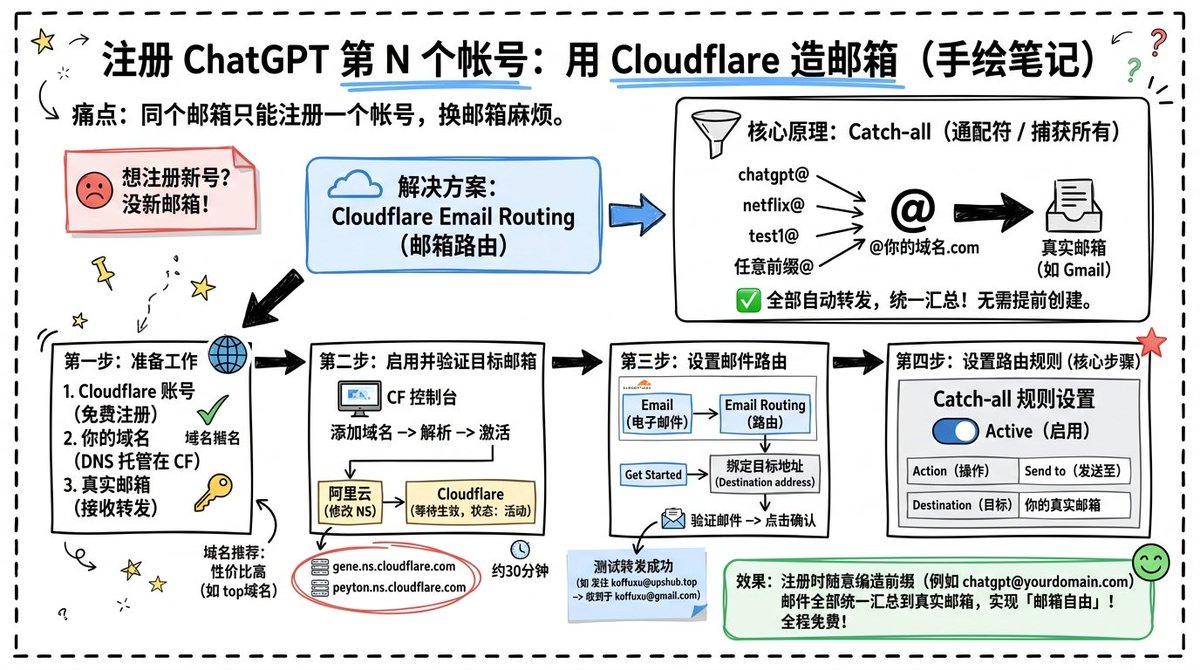
Using the provided reference image as the source infographic, create a 16:9 white-background comparison collage showing how different image models reproduce the same Japanese DX Report infographic.

Layout: Arrange exactly 4 discrete panels in a 2×2-style collage: top-left, top-right, bottom-left, bottom-right. Keep generous white spacing between panels.

Panels:
1. Top-left: show a mostly faithful smaller copy of the reference infographic, preserving the dense Japanese text, red/blue/green government-report layout, central “2025 cliff / 12 trillion yen loss” warning, left-side issues, right-side countermeasures, and bottom 2030 GDP goal. Add an orange label reading {argument name="top left model label" default="GPT-Image-2"} over the left-middle area.
2. Top-right: create a cleaner simplified ponchi-e style version of the same content with a red title bar, a yellow warning strip, a red stacked “current issues” box on the left, a large blue arrow in the center, a blue stacked “countermeasures” box on the right, and a green goal bar at the bottom. Add an orange label reading {argument name="top right model label" default="GPT-Image-1.5"} near the left issue box.
3. Bottom-left: create a more distorted simplified vertical version with a red “DX Report” header, yellow warning box, red issue blocks on the left, blue countermeasure boxes on the right, a large blue arrow, and green bottom goal bar. Add an orange label reading {argument name="bottom left model label" default="MAI Image 2 Efficient"} across the left side.
4. Bottom-right: create a simplified beige-background version with a dark red header, yellow “12 trillion yen loss” warning, red issue column, blue countermeasure column, large blue arrow, and green bottom goal bar. Add an orange label reading {argument name="bottom right model label" default="Flux.2 Flex"} near the left issue column.

Content to preserve conceptually: the comparison should clearly reference {argument name="report topic" default="DX Report 2025 cliff"}, with the same core flow from current problems to countermeasures and the 2030 GDP growth target. Make the top-left panel the most accurate and dense; make the other three panels visibly more simplified and less text-faithful, as a model-comparison visual.

Constraints: Use exactly 4 panels and exactly 4 orange model labels. Keep the Japanese infographic style readable where possible, with no extra watermark or unrelated objects.
Translations
DX 信息图模型对比
enUsing the provided reference image as the source infographic, create a 16:9 white-background comparison collage showing how different image models reproduce the same Japanese DX Report infographic. Layout: Arrange exactly 4 discrete panels in a 2×2-style collage: top-left, top-right, bottom-left, bottom-right. Keep generous white spacing between panels. Panels: 1. Top-left: show a mostly faithful smaller copy of the reference infographic, preserving the dense Japanese text, red/blue/green government-report layout, central “2025 cliff / 12 trillion yen loss” warning, left-side issues, right-side countermeasures, and bottom 2030 GDP goal. Add an orange label reading {argument name="top left model label" default="GPT-Image-2"} over the left-middle area. 2. Top-right: create a cleaner simplified ponchi-e style version of the same content with a red title bar, a yellow warning strip, a red stacked “current issues” box on the left, a large blue arrow in the center, a blue stacked “countermeasures” box on the right, and a green goal bar at the bottom. Add an orange label reading {argument name="top right model label" default="GPT-Image-1.5"} near the left issue box. 3. Bottom-left: create a more distorted simplified vertical version with a red “DX Report” header, yellow warning box, red issue blocks on the left, blue countermeasure boxes on the right, a large blue arrow, and green bottom goal bar. Add an orange label reading {argument name="bottom left model label" default="MAI Image 2 Efficient"} across the left side. 4. Bottom-right: create a simplified beige-background version with a dark red header, yellow “12 trillion yen loss” warning, red issue column, blue countermeasure column, large blue arrow, and green bottom goal bar. Add an orange label reading {argument name="bottom right model label" default="Flux.2 Flex"} near the left issue column. Content to preserve conceptually: the comparison should clearly reference {argument name="report topic" default="DX Report 2025 cliff"}, with the same core flow from current problems to countermeasures and the 2030 GDP growth target. Make the top-left panel the most accurate and dense; make the other three panels visibly more simplified and less text-faithful, as a model-comparison visual. Constraints: Use exactly 4 panels and exactly 4 orange model labels. Keep the Japanese infographic style readable where possible, with no extra watermark or unrelated objects.
DX 信息图模型对比
zh-CN以提供的参考图像作为源信息图,创建一个 16:9 的白色背景对比拼图,展示不同图像模型如何重现同一份日本 DX Report 信息图。 布局:采用 2×2 拼图形式排列 4 个独立面板:左上、右上、左下、右下。面板之间需保留充足的留白。 面板: 1. 左上:展示一个基本忠实于原图的缩小版信息图,保留密集的日文文本、红/蓝/绿政府报告布局、中央“2025 悬崖 / 12 万亿日元损失”警告、左侧问题、右侧对策以及底部的 2030 年 GDP 目标。在左中区域添加一个橙色标签,内容为 {argument name="top left model label" default="GPT-Image-2"}。 2. 右上:创建一个更简洁的“ポンチ絵”(讽刺画)风格版本,包含红色标题栏、黄色警告条、左侧红色堆叠式“当前问题”框、中央大蓝色箭头、右侧蓝色堆叠式“对策”框以及底部的绿色目标栏。在左侧问题框附近添加一个橙色标签,内容为 {argument name="top right model label" default="GPT-Image-1.5"}。 3. 左下:创建一个更扭曲的简化垂直版本,包含红色“DX Report”标题、黄色警告框、左侧红色问题块、右侧蓝色对策框、大蓝色箭头以及绿色底部目标栏。在左侧添加一个橙色标签,内容为 {argument name="bottom left model label" default="MAI Image 2 Efficient"}。 4. 右下:创建一个米色背景的简化版本,包含深红色标题、黄色“12 万亿日元损失”警告、红色问题列、蓝色对策列、大蓝色箭头以及绿色底部目标栏。在左侧问题列附近添加一个橙色标签,内容为 {argument name="bottom right model label" default="Flux.2 Flex"}。 需保留的概念内容:对比应明确参考 {argument name="report topic" default="DX Report 2025 悬崖"},并保持从当前问题到对策以及 2030 年 GDP 增长目标的核心逻辑流。左上面板应最准确且密集;其他三个面板应在视觉上更简化且对文本的还原度较低,以体现模型对比效果。 约束:必须使用 4 个面板和 4 个橙色模型标签。尽可能保持日文信息图的风格可读性,不得添加额外的水印或无关对象。