Network Graph Collaboration Map
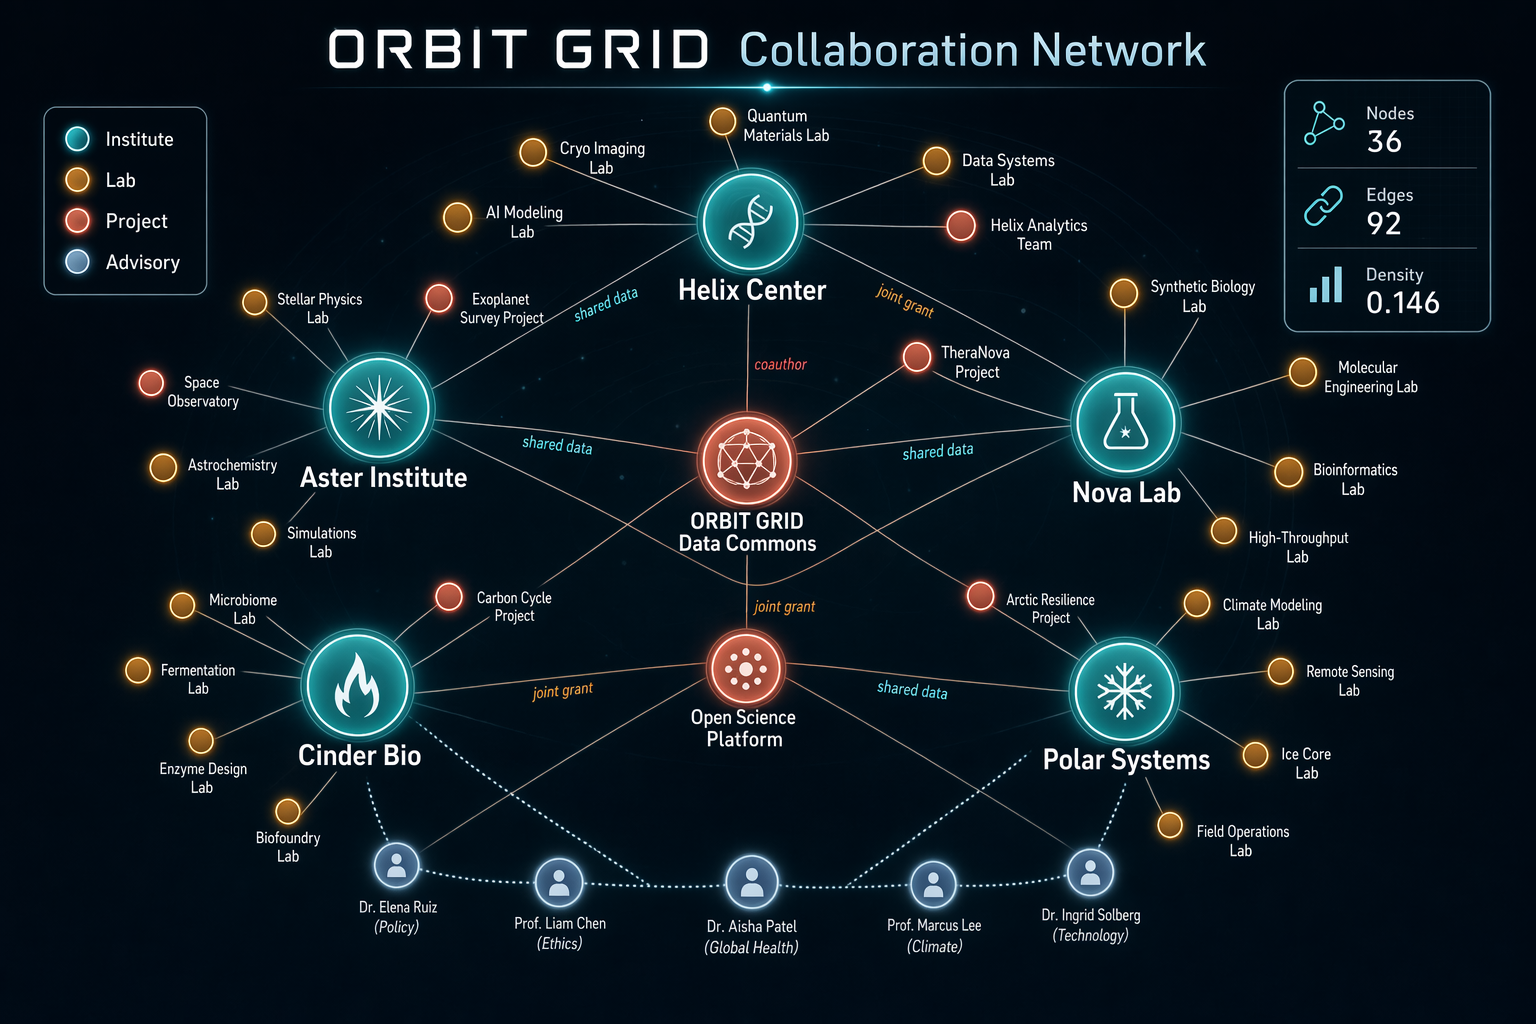
Generate a sophisticated network graph visualization on a dark charcoal canvas showing collaborations across a fictional research consortium called ORBIT GRID. Use glowing node col
- 分类
- 图表信息图
- 模型
- GPT Image 2
- 来源作者
- wuyoscar
- 原始语言
- en
- 来源 ID
- 108
完整提示词
Generate a sophisticated network graph visualization on a dark charcoal canvas showing collaborations across a fictional research consortium called ORBIT GRID. Use glowing node colors in teal, amber, coral, pale blue, and white, with fine connecting lines and clean labels. The composition should be balanced, readable, and intentionally designed rather than random. Include a title in crisp text reading "ORBIT GRID Collaboration Network" and a legend with "Institute", "Lab", "Project", and "Advisory". Show approximately 36 nodes, with larger hubs labeled "Helix Center", "Nova Lab", "Aster Institute", "Cinder Bio", and "Polar Systems". Add edge labels sparingly, such as "shared data", "joint grant", and "coauthor". Include a right-side stats card reading "Nodes 36", "Edges 92", and "Density 0.146". Emphasize clean hierarchy, accurate node-label placement, anti-overlap spacing, subtle depth, and crisp typography suited for a polished technical visualization generated by gpt-image-2.
多语言版本
Network Graph Collaboration Map
enGenerate a sophisticated network graph visualization on a dark charcoal canvas showing collaborations across a fictional research consortium called ORBIT GRID. Use glowing node colors in teal, amber, coral, pale blue, and white, with fine connecting lines and clean labels. The composition should be balanced, readable, and intentionally designed rather than random. Include a title in crisp text reading "ORBIT GRID Collaboration Network" and a legend with "Institute", "Lab", "Project", and "Advisory". Show approximately 36 nodes, with larger hubs labeled "Helix Center", "Nova Lab", "Aster Institute", "Cinder Bio", and "Polar Systems". Add edge labels sparingly, such as "shared data", "joint grant", and "coauthor". Include a right-side stats card reading "Nodes 36", "Edges 92", and "Density 0.146". Emphasize clean hierarchy, accurate node-label placement, anti-overlap spacing, subtle depth, and crisp typography suited for a polished technical visualization generated by gpt-image-2.